SUMMARY
This paper overviews a three-year project to develop a national infrastructure for artificial intelligence (NI4AI) on the power grid through a three-part, multi-million dollar effort funded by the Advanced Research Project Agency - Energy (ARPA-E). The first major component of this project is the deployment of a variety of high-frequency grid sensors to capture both wide-scale and localized grid behavior, generating high-value datasets for research. The second aspect of this project is the deployment of a horizontally scalable, cloud-based data management and AI platform built for time series data to store, process, analyze, and learn from grid sensor data. Finally, the project seeks to cultivate a diverse and open research community composed of experts from numerous fields through focused educational content, code sharing, and data science competitions. The project’s goal is to accelerate the development of analytics, machine learning, and AI to improve all aspects of the power grid.
KEYWORDS
Grid, analytics, artificial intelligence, community, machine learning, open data
1.INTRODUCTION
The electric grid evolved in an environment of severe information scarcity. This was acceptable historically because the interconnected system was somewhat simpler; nor were there known options for gaining access to detailed, real-time information. Absent such information, the grid’s operation has relied on large margins of overbuilt capacity, responsive fossil-fuel based generators with inherent energy storage (fuel and rotating mass), strictly unidirectional distribution systems, and operator discretion in the face of uncertainty. These “survival strategies” have become problematic today.
Operating a more efficient and agile grid with diverse resources alongside fast, automated disturbance responses requires a new level of insight and a new fundamental approach -- without which the system is poised to become uneconomical, unreliable, or even unstable in ways that can surprise the best experts. For example, wide-area power oscillations occur that were never predicted by system models, unknown amounts of generation behind customer meters can be suddenly lost, and protection systems can trip unexpectedly to cause outages. Indeed, the lack of system understanding and situational awareness from grid data were identified as major causes of the 2003 Northeast Blackout [1]. To mitigate the interconnected complexity of the modern grid, automation and data-driven approaches with new levels of insight and fundamentally new approaches are required to ensure the system remains reliable, economical and stable.
In response to this diagnosis, a large investment was made to install phasor measurement units (PMUs) nationally but the utilization of this sensor data falls far short of the potential. Although this data has technically been available, these sensor deployments were never matched with a storage or computational framework that would enable analytics. Moreover, continuous point-on-wave sensors are the next generation of sensing which will augment existing grid sensing including 30-year old PMU technology. This transition will move the industry from the equivalent of old, black and white television to ultra-high definition 4K television. Rapid and tremendous advances in the cost-effective leveraging of big data—first in analytics, next in machine learning, and then with deep learning—have revolutionized many complex technical systems. Despite the possibility of diverse sensors creating a fertile ground for analytics, machine learning, and AI, the energy industry has been slow to adopt these technologies to address the growing demand for reliability, security, and resiliency of an increasingly complex grid.
2.PROBLEM
The utility industry’s pace of innovation with regard to the development and deployment of analytics, machine learning, and artificial intelligence is and has been fundamentally hampered by three issues: (1) data, (2) tooling, and (3) people.
(1) Data - The first and most obvious problem is the lack of data about the actual operating state of the grid, and the lack of accessibility to the data that does exist. From an ideological perspective, the field of power engineering was built on physics-based models defined by equations that were understandable in principle and could be made mathematically tractable by way of simplifications and approximations (e.g. assuming balanced, three-phase systems with purely sinusoidal signals). This is in stark contrast to the origins of the contemporary big data revolution where no such models (for example, a model derived from first principles to describe the arrival of a Tweet) are available. Thus, the models underpinning Silicon Valley are not of physics but of data. While the physics-based approaches will continue to be useful, the power engineering world has been slow to embrace the data-driven approach as it represents a potential large departure from the current ideology.
From the vantage point of contemporary data science, the common approach to data governance in the utility industry appears outdated, clumsy and unnecessarily limiting. In an industry renowned for being risk averse and slow to change, utility sensor data remains largely inaccessible to both internal and external consumers. Efforts to leverage sensor data at scale within utilities are hamstrung by legacy data historians designed solely to archive data, and not to actively use it. Cumbersome user interfaces of such systems hamper the interactive exploration of data that should, in fact, be the first step in analytics development. The lack of efficient interfaces is exacerbated by the fact that data from different sensor types or manufacturers is intentionally isolated in different, proprietary data silos, preventing easy access by utility personnel from different departments. Data from live systems and sensors, especially at the scale needed to train ML and DL algorithms, is simply not available outside of utilities, and remains locked behind months of legal negotiation and utility firewalls in proprietary systems.
(2) Tools and Infrastructure - AI and machine-learning related work is impossible without the appropriately performant data infrastructure and tooling. As described before, the data historians used by the industry were designed for the efficient archiving of data, often by destroying the high-resolution information with lossy compression schemes or temporal down sampling. Just like the grid conveniently supplies electricity and end users simply plug in, data infrastructure must make accessing and using this data as simple as possible as well. Downloading comma-separated-value files (CSVs) simply does not work in this age of petabyte data sets. Further, popular analytic tools including Microsoft Excel and Mathworks MATLAB were designed long before distributed computing became the norm and machine learning rose in prominence.
A fundamental aspect of such tooling is to address data quality. Without standardized and automated ways to clean data and provide feedback about data quality in real time, data quality becomes a labor-intensive activity repeated by each effort to use the data and ultimately decays until the data source becomes unusable.
The analytics pipeline ends with knowledge and insights turned into production analytics that continue to provide value long after development is complete [2]. Traditionally, when solutions are identified within a utility, deployment to production is hampered by tooling, vendor expertise, IT policy, and other factors. When potential solutions are identified by universities, research institutions, and even vendors, the tools and systems used by such collaborators are so different from the utility’s that cost-effective deployment of results is not possible. Far too often, potentially disruptive academic/industry research languishes as papers and will never get deployed or even tested on real data.
(3) People - The words of Google’s Chief Economist from 2009 seem prophetic today:
“The ability to take data – to be able to understand it, to process it, to extract value from it, to visualize it, to communicate it’s going to be a hugely important skill in the next decades, not only at the professional level but even at the educational level for elementary school kids, for high school kids, for college kids. Because now we really do have essentially free and ubiquitous data. So the complementary scarce factor is the ability to understand that data and extract value from it. … I keep saying the sexy job in the next ten years will be statisticians. People think I’m joking, but who would’ve guessed that computer engineers would’ve been the sexy job of the 1990s?”
The skills described above by Hal Varian are outside the wheelhouse of typical power systems engineers through no fault of their own. As data science has transformed industry after industry (and created new ones), the bidding war for individuals at the forefront of this field continues. PhD students focused on deep learning have been able to command salaries of half a million dollars a year and more directly out of school with top tech companies. Not surprisingly, traditional industries like power utilities who cannot "go fast and break things" are unable to match the Silicon Valley culture and salaries, making it difficult to invest resources to attract and retain top data science and artificial intelligence talent.
3.THE SOLUTION
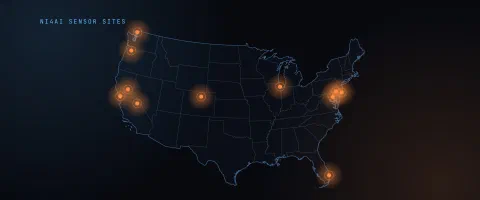
We are taking a holistic, three-pronged approach to address all three, interconnected problems listed above shown in figure 1. First, the project seeks to create a hyperscale grid sensor data resource with unencumbered access to the data, enabling quick and cost-effective collaboration among traditionally siloed parties. Second, the project is making available a “third-generation” data management, analytics, and AI platform architected for high density grid sensor data [3]. The core technology of the platform, from the novel data structure used to persist data on disk all the way up the stack, was engineered with the requirements of machine learning and AI in mind. The aim is to not only put the best tools and infrastructure in place, but to free collaborators from the setup and maintenance of such systems. Finally, this project will also work to build a vibrant community around this data and tooling through focused educational content, online code sharing and versioning, and programming and AI competitions.
The fusion of the three project thrusts - data, platform, and community - creates positive feedback that will increase the overall value and usage of the platform and its data: classically speaking, the whole is greater than the sum of its parts.
3.1The Data
“Data provides the evidence for the published body of scientific knowledge, which is the foundation for all scientific progress. The more data is made openly available in a useful manner, the greater the level of transparency and reproducibility and hence the more efficient the scientific process becomes, to the benefit of society.” [4]
Open data sets like the MNIST database of handwritten digits have helped propel the exponential advancement of data science [5] and machine learning techniques. The benefits of open government data are not only exemplified by the trillions of dollars in economic value created by available weather data, the global positioning system, and satellite imagery but have also been extensively studied and categorized [6-9]. Open and accessible data has been a major catalyst for innovation in numerous fields and could have the same sizable impact on the grid space.
This project will create three open, accessible, grid-scale data sets - (1) in vivo, (2) in vitro, and (3) in silico data sets - in parallel. The data captured across the three data types will be made available for use via the platform, detailed later in the paper.
(1) In vivo - Different types of high frequency grid sensors, sampling at 30Hz or greater, will be deployed two create two different types of data sets.
The first type of in vivo data is a wide area data set that offers continuous monitoring of the grid over a very large geographic region. In this case, we expect continent scale coverage with at least phasor measurement units but have also considered point-on-wave sensors as well. This data set will continuously grow in time as more data streams to the platform.
The second type of in vivo data are boutique data sets, capturing the behavior of very specific parts of the grid with dense local sensor coverage and finite periods of time. The project aims to create multiple boutique data sets and potential subjects for instrumentation include but not limited to:
- solar farms,
- wind farms,
- EV charging stations,
- micro-grids,
- areas predisposed to forest fires, and
- areas subject to geomagnetic disturbances.
We are also considering the fact that excellent research data sets may have already been collected and actively searching for such that could be made available as part of this project. Importantly, all of the data from deployed sensors and synthetic models/simulations will be made broadly available. If needed, the data sets above can be anonymized in such a way as to not pose privacy or security concerns for the original source.
(2) In vitro - A subset of the sensors used to create the in vivo data set will at first be tested under controlled conditions, exposed to signals of known characteristics so that the sensor response can be captured with this output made available via the platform described below.
(3) In silico - The third type of data made available through the platform will be simulated sensor data from complex grid models. The scale and complexity of the grid demand high dimensional simulations using models to make critical decisions regarding capital investment and long-term system planning, controller and protection settings, as well as post-mortem and post event analyses. Synthetic modeling of the grid and its measurements is typically a prerequisite for research and development initiative yet can be very costly and time consuming. Mathematical models and simulations represent the behavior of an idealized grid, the real-world version of which is measured by sensors. It is logical for the tools that we use should fuse these two worlds together. If high quality data sets from simulations are made available on the same platform as real data from the grid, the result is a fusion of efforts that will maximize analytic development activity. The national infrastructure platform will provide data to users in such a way that model or simulation-derived data, virtual sensor data, and real-world data are presented in the same manner so that the same tools and systems are used to analyze them and deploy analytics.
Data Escrow - There remains a valuable yet untapped opportunity that can be created by this project. The national infrastructure will facilitate faster, more secure, and more cost-effective exchange of secure data via an escrow capability. Utilities that want to share data sets with specific organizations or individuals can do so by uploading them to the secure, encrypted platform where the data can be automatically run through hygiene algorithms to optionally purge any CEII information from the meta data, provide basic data quality improvements, and catalog the data set. From here, utilities completely control which individuals or organizations can access the data, choosing to make it open and available to everyone, or restricted to simply their collaborating university. The benefit to this is that much of the labor associated with sharing data is handled automatically by the national infrastructure. As a third party, the infrastructure and its team can help ensure a higher level of fidelity and security for the data while focusing primarily on the technology and enabling the community.
3.2The Platform
With virtually unlimited scaling capacity available in the cloud, the question of many analytics has moved from the question of “is it possible” to “is it affordable for the expected value created.” The state of the art in big data platforms has moved from both first-generation systems—general purpose batch processing platforms, exemplified by map reduce and Hadoop—and second-generation systems—general purpose big datastores and processing frameworks such as Cassandra and Spark respectively—to third generation systems. These third-generation systems are purpose built with specialized data structures and architectures optimized for a particular data type, use cases, and even industry.
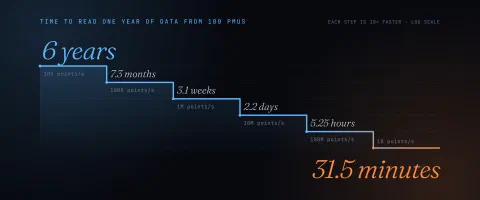
The use and analysis of high-density telemetry or time series data, composed of regular measurement(s) and a high-resolution timestamp from electric grid sensors, require such a third-generation system. For time series platforms, the key metric is the number of data points that can be written or read per second per compute resource. A survey of contemporary time series data stores finds the best able to write, at peak, approximately 1M+ points per second. Two hundred microPMUs, each generating 40 streams of 120Hz high-precision values with timestamps accurate to 100 ns, produce nearly 1M+ points per second; many transmission utilities in the United States already exceed this number of PMUs.
Critical to the success of the project is performant infrastructure and best in class tooling provided by a universal sensor analytics and AI platform detailed at last year’s grid of the future paper. This is an open, state-of-the-art platform to ingest, store, cleanse, visualize, and altogether process grid data from sensors and other valuable sources deployed in such a way that it is easily accessible by members of the industry in order to enable artificial intelligence analytics as a first-class citizen. The horizontally scalable platform can ingest sensor data streams from millions of sensors simultaneously while also supporting asynchronous training and analytics tasks. The platform leverages open source software components, uses open data formats, and runs as a platform-as-a-service in major commercial clouds for reliability, resiliency, scalability, accessibility, and reduced cost.
Within the platform, time series and other sensor data are archived with version control on the Berkeley Tree Database (BTrDB), which uses a novel abstraction and data structure for telemetry time series data—a time-partitioning version-annotated copy-on-write tree—that provides incredibly performant, temporally hierarchical access to sensor data [10]. BTrDB collects and stores many concurrent, high-bandwidth, potentially unordered streams without data concentrators. It uses a novel time-partitioned index that provides consistent versioning, extremely fast change-set identification for robust on-the-fly distillation, and multi-resolution statistical summaries that enable fixed response-time queries and logarithmic isolation of rare critical events in massive time-series, independent of the size of the underlying data. For example, locating the handful of voltage sags in 3.4B points comprising a year of data requires less than 200ms [10].
In initial benchmark tests of BTrDB, performance of 53 million inserted values per second and 119 million queried values per second have been sustained on a small, 4-node cluster before efforts to optimize and parallelize the database. In more recent testing, a small instantiation of the platform running in Amazon AWS successfully ingested and processed 90,000 simultaneous streams, each reporting 120 measurements per second. Further, testing has demonstrated that the current data platform could scale horizontally to handle the simultaneous ingestion of nearly 100,000 synchrophasors; to place this in perspective, there are estimated to be approximately 5,000 stand-alone transmission PMUs currently deployed and active in North America.
For advanced analytics and general computational capabilities, we employ Apache Spark, a fast and general-purpose engine for large scale data analysis. Spark has prebuilt libraries to handle both graph-based processing and in-memory machine learning approaches plus the ability to handle real-time data in micro-batches. Google’s TensorFlow augments Spark’s ML capabilities with deep learning. Finally, the platform contains a distributed analytics and computational framework designed to operate across time series in parallel, executing faster than real time [11]. All will be made available to the community.
Visualization on the platform is highly performant and interactive on arbitrarily large data sets. We circumvent the classic trade-offs faced by visualizers between quantity of data and time-to-render by taking advantage of key design decisions in the underlying database. Specifically, the ability to query data at varying time resolutions with consistently low latency allows the visualizer to request the ideal amount of data for display (1 data point per pixel). By breaking the relationship between the quantity of data and query latency, fully interactive visual exploration is possible. Furthermore, visualization of real time data and even updates to past data are trivially accomplished due to the database’s stream versioning. Finally, algorithms for intelligently prefetching the data a user is likely to view next as well as caching strategies further enhance perceived performance [12].
3.3The Community
The size, complexity, and lengthy history of the grid, along with the fact that it crosses multiple organizational boundaries, suggests that the problems described above cannot be solved by the actions of a single entity or group. The third major thrust of this project is to bring together a diverse and broad community of individuals and organizations to help improve the grid, a critical national resource, using data driven methodologies. This project will attempt to bring together transmission system operators, distribution system operators, municipalities, independent system operators, reliability coordinators, national laboratories, universities and colleges, hardware and software vendors, consultants, and regulating bodies.
The project team has proven a core hypothesis - that easier-to-access data will increase the rate of innovation and result in new use cases for the data - within a large transmission utility. Thus, performant and easy-to-use tooling and infrastructure combined with world class datasets ripe for exploration provides strong incentives to industry stakeholders who share a common mission: namely, to provide clean, reliable and affordable electricity to power our society. However, the project will provide substantial additional incentives to accelerate innovation and potential impact in several forms. First, the project team is generating substantial content not just in how to use the platform but also understanding some of the inner workings of the platform and how different design decisions were made. This content will be made available online through blog posts, executable Jupyter Notebooks, and videos. Traditional power engineering curriculum typically do not include strong computer science components, especially around distributed and parallel computing, data structures and databases, or machine and deep learning algorithms. Second, the project team will host conferences attached to major workshops and meetings, leveraging existing events that bring industry participants together. Finally, the team will hold competitions involving data sets that are created with objectives and problems sourced from the industry and community. Open data science competitions such as the original Netflix Prize, KDD Cup, Kaggle.com, and others that promote the focused use of released data assets have catalyzed diverse expert teams across traditional research boundaries and advanced the state of the art. [13-15].
While innovation is somewhat of a nebulous concept, the community built by this effort can be quantified to measure the success of this aspect of the effort. One direct measure of this community and a proxy for innovation is the interconnectedness between the universities and national laboratories doing fundamental and applied research as well as the utilities that operate the electric grid. As these organizations are composed of a finite set of individuals, we can enumerate this space of experts. Further, their collaborative efforts create output products that specifically identify the connections between these individuals. Thus, we can map out the links that exist between the individuals representing the universities, national labs, and utilities, creating an innovation network both knowable and quantifiable. Further, as the platform is designed for collaboration, we can measure not only the new “nodes” that enter into this network but also the new connections that form between individuals, creating more diversity in the field to better solve problems [16]. Thus, we can measure the increased connectivity between universities, national labs, and utilities. Another important, measurable proxy is the time it takes for a new use case to be developed and deployed by a utility.
4.FIRST STEPS IN 2019
While the project has officially begun in August of 2019, numerous steps have been taken to develop and test the data platform as well as to broadcast the project’s intentions and start to recruit numerous types of partners moving forward. This section lays out the roadmap for the remainder of 2019, especially enumerating specific “calls to action” for the community.
- Data - Over the next quarter, the project team will be making numerous decisions about which sensors to deploy and where to deploy them. We are actively seeking input from the industry.
- Platform - Initial platform work will be focused on the following tasks:
- Development of an Open Time Series Benchmarks - no standardized way exists to measure the performance of time series databases or the performance of one time series database deployed in different environments. We will be constructing an open source benchmark
- Evaluation of Potential Cloud Providers - with a standardized benchmark created, the platform can be evaluated while running on different cloud providers to understand the price and performance characteristics of major identified cloud providers so that an optimal selection can be made for the project.
- Demo Platform Launch - as soon as possible, an initial, smaller scale version of the platform will be made available for the community to use and test.
- Community - Initial efforts for building the community will be composed of the following:
- Launching the Blog - the project team is particularly excited about launching the blog as we seek to create as much transparency about this project and its results as possible. The blog will feature content generated internally and also guest bloggers to capture and disseminate written knowledge far faster than the traditional academic publishing cycle can facilitate.
- Recruiting the First Wave of Partners - the project team is also eager to start building the relationships that will make this project successful and onboarding researchers and analysts onto the platform.
5.CONCLUSION
The open national infrastructure for artificial intelligence fundamentally disrupts the entrenched, haphazard model of technology innovation in the utility industry and circumvents the current patchwork of tools, “walled gardens,” and attempts at vendor lock-in. For example, contemporary grid analytics that utilize high resolution sensor data are truly in their nascent stages. Several vendors maintain solutions for analytics that are limited in scope and scale and can’t be improved by the community. Utility use of this data type is generally limited to short term trending displays, ad-hoc post-mortem analysis, or Excel-based calculations. Tool insufficiency is only one component of the problem. Deploying a sensor network or building a new sensor or applying deep learning may address a particular problem in a technology subcategory but, enabling the rapid development of AI across the grid requires all of these ingredients in a comprehensive and layered approach. Each component of the AI infrastructure requires innovation, increases in value when integrated into the other components, and improves on current solutions. Via the integration of collaborative tools and the creation of a user community with a collaborative mindset, we aim to disrupt not just the technology but also the incumbent culture.
From a philosophical perspective, this project attempts to no less than radically transform the industry by bringing openness and accessibility not just as theoretical concepts but guiding principles to accelerate the rate of innovation in a historically cautious industry. We see tremendous potential for project participants to realize data-driven applications using machine- and deep-learning that can drive efficient use of grid assets or decrease carbon emissions. Development of a national infrastructure for AI driven by sensor data measuring the electric grid will help make the idea of the grid of the future a reality today. Above all, we seek to build a true platform, where the winning strategy for innovation “has moved from controlling unique internal resources and erecting competitive barriers to orchestrating external resources and engaging vibrant communities.” [17]
BIBLIOGRAPHY
- [1] U.S.-Canada Power System Outage Task Force Natural Resources Canada, U.S. Department of Energy, Final Report on the Implementation of the Task Force Recommendations, September 2006. URL: https://www.energy.gov/sites/prod/files/oeprod/DocumentsandMedia/BlackoutFinalImplementationReport%282%29.pdf
- [2] Murphy SP and Jones KD, Learning from Data: Fixing the Analytics Pipeline to Increase the Rate of Grid Evolution, CIGRE Grid of the Future Conference, Oct 2017.
- [3] Murphy SP, Andersen M, Jones KD, Bariya M, Schuman J, A Universal Sensor Analytics and Artificial Intelligence Platform for the Grid, CIGRE Grid of the Future Conference, Fall 2018.
- [4] Molloy, Jennifer C. "The open knowledge foundation: open data means better science." PLoS biology 9.12 (2011): e1001195.
- [5] Y. LeCun, L. Bottou, Y. Bengio, and P. Haffner. "Gradient-based learning applied to document recognition." Proceedings of the IEEE, 86(11):2278-2324, November 1998. [on-line version]
- [6] M. Janssen, Yannis Charalabidis, and Anneke Zuiderwijk. "Benefits, adoption barriers and myths of open data and open government." Information systems management 29.4 (2012): 258-268.
- [7] Juell-Skielse, Gustaf, et al. "Is the public motivated to engage in open data innovation?" International Conference on Electronic Government. Springer, Berlin, Heidelberg, 2014.
- [8] “Fostering Innovation, Creating Jobs, Driving Better Decisions: The Value of Government Data.” Economics and Statistics Administration Office of the Chief Economist, 2014. [Online version http://www.esa.doc.gov/sites/default/files/revisedfosteringinnovationcreatingjobsdrivingbetterdecisions-thevalueofgovernmentdata.pdf]
- [9] Bizer, Christian, Tom Heath, and Tim Berners-Lee. "Linked data-the story so far." International journal on semantic web and information systems 5.3 (2009): 1-22.
- [10] Andersen M and Culler D, BTrDB: Optimizing Storage System Design for Timeseries Processing, Fast '16 14th USENIX Conference on File and Storage Technologies, Feb 2016.
- [11] Andersen M, Kumar S, Brooks C, von Meier A, and Culler DE. 2015. DISTIL: Design and implementation of a scalable synchrophasor data processing system. In Smart Grid Communications (SmartGrid- Comm), 2017 IEEE International Conference on. IEEE, 271–277.
- [12] Kumar S, Michael P Andersen, and David E. Culler, Unifying data reduction in storage and visualization systems, SIGMOD’18, June 2018, Houston, Texas, USA
- [13] Netflix Prize Archived Website [https://web.archive.org/web/20090924184639/http://www.netflixprize.com/community/viewtopic.php?id=1537]
- [14] KDD Cup - URL: http://www.kdd.org/kdd-cup
- [15] P Dugan, W Cukierski, Y Shiu, A Rahaman, and C Clark. “Kaggle Competition”. In: Cornell Univerity, The ICML (2013).
- [16] Hong L, Page SE. Groups of diverse problem solvers can outperform groups of high-ability problem solvers. Proc Natl Acad Sci U S A. 2004 Nov 16;101(46):16385-9. Epub 2004 Nov 8.
- [17] Sangeet Paul Choudary, Marshall W. Van Alstyne, and Geoffrey G. Parker. 2016. Platform Revolution: How Networked Markets are Transforming the Economy--And how to Make Them Work for You (1st ed.). W. W. Norton & Company.