SUMMARY
The grid is vastly complex. From engineers to executives, we work tirelessly to quantify, assess, and subsequently improve this incredibly important machine. Whether in the past, present, or future, exact modelling of physical processes in the grid is of fundamental importance. However, the growing complexity of the grid and its interdependencies between other natural and man-made systems will require a new paradigm for deriving insights into planning and operations. Vast amounts of data from varied and disparate sources need to be combined and analyzed with modern technologies and techniques.
Today, we are unnecessarily limited by our inability to quickly test our hypotheses with data. The systems we build to collect, store, and access data and the process by which we analyze data (the contemporary analytics pipeline) inject inordinate delays and complications that often prevent analysis altogether. As a direct result, utilities are slow to develop and deploy new use cases and applications based on data from new sensing modalities like PMUs, slowing the rate at which the industry learns and evolves. When creating analytics pipelines for the grid of the future we have to marry policy and technology to maximize our ability to quickly iterate and learn from data. To facilitate this, we require a shift in philosophy to one where data is considered an asset just like those made of iron, steel, and copper.
KEYWORDS
analytics pipeline, PMU, data analysis, data science, learning rate
INTRODUCTION
Electric utilities, large engineering-driven organizations, have used data since their inception. Based on the technology available at the turn of the 20th century, data was captured by utility engineers traveling to the sensor’s physical location and recording monthly measurements by hand with pen and the inexpensive but bulky storage format of paper. With the advent of SCADA beginning in the 1960’s and 1970s, we evolved out of necessity into a paradigm of continuous data collection. Over the coming decades, the number of parameters collected and archived increased. However, we have witnessed over the second half of the 20th century how the growing complexity of the grid has far outpaced our ability to monitor it. While the industry has moved forward substantially, it faces an ever-growing demand for more and better data with radically larger volumes, higher velocities, and greater varieties than ever before.
This revolution in the scale and use of data is being cautiously considered by the industry as it arises from sources both internal and external to utilities. Specifically, utilities have nearly 5,000 dedicated Phasor Measurement Units (PMUs) active on transmission assets - a deployment that started over a decade ago. As the technology has improved, numerous manufacturers have embedded phasor measurement capabilities into devices such as digital relays. Dr. Edmund O. Schweitzer III, President and Chairman of the Board of Schweitzer Engineering Laboratories, indicated that, if one counted the number of smart relays deployed with phasor measurement abilities, there would be nearly 500,000 PMUs already installed on the grid by his company alone [1]. With smaller (and aptly named) micro-PMUs from such manufacturers as Power Standards Laboratories an order of magnitude less expensive than standard transmission PMUs, operators on the distribution side of the grid, as well as commercial and government organizations, are starting to deploy these sensors, which sample data at 60 Hz and above [2]. Data rates of this kind are one to two orders of magnitude beyond traditional grid data rates. Other utility deployed sensors, such as digital fault recorders (DFR), capture direct measurement of the AC waveforms at thousands of samples per second when triggered by a particular system condition. Some DFRs can even simultaneously serve as PMUs that continuously monitoring the grid alongside intermittent bursts of much higher frequency data from a captured event.
Beyond traditional utility owned and operated sensors are numerous sources of data that are directly relevant to the reliable and economic operation of the grid. For example, some companies are using drones to survey vegetation density around power lines, monitor line sagging to estimate impedances. and inspect towers, in some cases supplying video to the utility. Further, there are many real-time streaming data sources that describe phenomena whose relationships to grid performance and operation are hard to quantify and predict with physics based models. These include weather data, climate data, precipitation data, lightning strike data, wind data, and many other sources that could be used to better monitor and understand the grid, a massively complex system itself that is interconnected with other “systems” both natural and man-made.
Despite this veritable treasure trove of available data, utilities have not yet realized the full potential of this valuable asset. Per Ganesh Bell, the Chief Digital Officer of GE Power, “[t]he problem is that just 2 percent of all the terabytes and petabytes of data generated by connected power plants, wind farms, grids, substations and energy management systems is being analyzed and used today.” While many other industries have adopted the stance that data is an asset, utilities do not yet regard data the same way as they do a transmission line, substation, or generator.
The operative question is why. Why haven’t utilities unlocked the latent value contained in data? There are virtually no material barriers. Storage is cheap. Memory is cheap. Computing is cheap. Horizontally scalable and robust data storage and analysis platforms can be built with open source software. From a cultural perspective, fresh graduates joining the utility workforce were born in the 90’s and experienced teenage life with a smartphone. To this group, even trivial aspects of life are quantified and no one would question the utility of data. To address this all-important question—why aren’t utilities using data more—this paper examines the contemporary data analytics pipeline used by utilities to explore, analyze, and understand data.
THE CONTEMPORARY DATA PIPELINE
To understand the answer to this critical question, one must examine the current state of data analytics efforts within utilities and how analytics is or is not accomplished. Figure 1 captures the ad-hoc analytics pipeline used by the industry, based on conversations with experts from a number of utilities. In other industries, it may be more accurate to merge multiple stages into a single stage or break some stages into multiple parts, or even omit the first stage. However, this particular representation fits the utility industry well.
To analyze and subsequently learn from data, a utility engineer or analyst must walk through each of the steps of this process above in sequence. The time that each stage of this workflow consumes governs how long it takes (if ever) for utilities to leverage and learn from data. More directly, it determines how quickly new use cases for PMU (and other) data can emerge and the value that can be extracted from a massive and increasingly growing asset. Ultimately, it governs the rate at which utilities can evolve.
Discussions with numerous transmission and distribution utilities have identified bottlenecks in each of these stages. These bottlenecks slow the progress through the workflow and the rate of iteration for analytic development, thus decreasing the speed of experimentation and learning. These stages and the associated bottlenecks are discussed below.
(0) Capture - The initial stage of the pipeline is data capture. This includes both measurement - the periodic collection of data in which deployed sensors translate physical characteristics into numeric values - as well as transmission - the subsequent movement of this information to an often-remote system for storage and access. This step is often not included in the analytics pipeline as its occurrence is assumed; analysis simply cannot happen without data. However, this assumption does not always hold in the utility industry. Data that is only archived and not driving downstream applications or otherwise being consumed is data that has never been examined hiding unknown problems in the data capture stage. Additionally, because the sensors are remote, there is significant opportunity for this stage to cause the degradation of measurements via a number of mechanisms and materially impact the ability to utilize the data [3]. This attribute further demonstrates the need to include this in our model.
The successful capture of synchrophasor data requires a number of independent assumptions to be met. First, the PMU in question must be working and configured correctly. Second, the communications channel along the path to downstream systems must have sufficient bandwidth for the data rate being transmitted and must, of course, be functional itself. Third, many system architectures for PMUs contain a complex path that requires data to flow through numerous concentrators and other components before ultimately being archived. Last, the final destination must then accept and archive the data without loss and, preferably, persisted with some level of replication so that a server or hard drive failure does not permanently destroy data.
If there is a problem at any point along this path, data capture fails. In organizations that do not immediately examine or use captured data, errors in this phase are unlikely to be discovered and the root cause for those errors will persist. In experiences with over 50 terabytes of operational PMU data, we have seen errors arise from each step of the data capture step described above.
(1) Access - The final resting place for a large percentage of utility data is the traditional data historian which is often built on top of a relational database. For the analytics process to start, the individual in question must be able to access the data and, therefore, must be able to access the historian. If the individual is not an employee within the utility, access to the data will be virtually impossible. This fact alone serves as a significant blocker to external collaborators in National Laboratories and traditional universities who want to conduct research, test hypotheses, and develop new ideas for the utility industry. Even if the analyst or engineer is inside of the utility, access is not guaranteed. This is typically because the historian is controlled and maintained by the utility’s IT department. Traversing this internal bureaucracy can consume significant time, measured in days, weeks, or even months.
(2) Acquisition - Once access to the historian has been granted and sufficient user privileges acquired, the utility engineer must query the historian for the data. As the traditional data historian is designed for archival purposes and not analytics, the data must be transferred to the engineer’s preferred computer, often a laptop or desktop. In business parlance, the data is transferred from a position of low value (the historian) to a location of higher value (the analyst’s computer). This is done over the utility’s existing internal network, often a bottleneck itself, before any analysis can be done. Not uncommon is to see a data export requiring days of time to execute failing unexpectedly, requiring the process to be restarted from the beginning. Extraction of time series data from monolithic, relational databases tends to not be performant for technical reasons even when we ignore the potential misalignment of incentives due to common vendor lock in strategies.
In contrast, this approach differs sharply with more modern data architectures. One of the central tenants of Hadoop, the open source realization of Google’s map-reduce paradigm for distributed computing [4], was to move the computation to the data instead of moving the data to the computation. The pragmatic reason for this philosophy was that data is most often orders of magnitude larger than the program interrogating the data and bandwidth is finite, especially between different computers. Google’s paper was published in 2004 and, at that point, had been in operation internally at the company for several years.
The structural downsides to the common utility approach are numerous. Once the data leaves the historian, it creates multiple copies of the data that are no longer auditable nor trackable by the central system. Further, if the historian receives data out of order, the analyst’s local copy will likely not be updated and the resulting analysis will be on stale data and likely invalid. A better data architecture would capture an immutable original version of the data that is then replicated. This replicated copy of the data could then be accessed and updated and even forked, with strict version control in place and tracking of access and location.
(3) Wrangling and Cleaning - Once data has been acquired and is available for work, the data must be wrangled or munged, work that is the bane of data analysts and engineers everywhere. Data “wrangling” is the process by which raw datasets retrieved from one or more locations can be made more applicable and convenient for consumption by downstream steps in the process. Unfortunately, it is well known in the world of data science practitioners that the data wrangling stage can consume upwards of 80% of project time.
The ingested data is cleaned and brought together, often through relational joins and/or simple append operations. Often times, the result of this step is a single flat table. For cleaning, categorical variables are created, missing data is handled, dates are formatted and properly converted, among many other steps. The statistical properties of the data are checked to ensure that what will be used in the modeling or analysis phase is what was expected.
Synchrophasors represent an unprecedented improvement in the measurement capability of a utility because their time synchronized, high resolution, phasor values truly measure the state of the system. However, synchrophasor data quality is a known problem in the industry due to numerous problems including issues with the communications infrastructure and improper sensor configurations. For each analysis effort, the engineer who pulls synchrophasor data must identify and address each and every data quality issue, correcting for missing data, corrupted timestamps, null values, repeated floating point values, and many more.
(4) Analysis and Modeling - Once the data is sufficiently clean, the analyst can begin the line of investigation for which he or she had initiated the effort. Many efforts in this stage, such as testing a hypothesis, building a statistical model, or training a machine learning classifier, are exploratory in nature and not as predictable in outcome or required length of time to achieve any result, let alone the one desired. In fact, it is not uncommon that such work fails to disprove the null hypothesis. Analysis tasks are much closer to science than engineering and thus share more of the characteristics of such work.
(5) Visualization, Reporting, and Results Propagation - Data analytics projects can be seen as an effort to construct an argument from data - a story that will compel others to take action. Data visualization is key to weaving a narrative for this report. Visualization summarizes and condenses volumes of numerical data into a picture that can be embedded into a report and quickly digested by the reader. For an analysis to be adopted and ultimately become a successful use case, the results and the code must be disseminated to a wide audience both within the utility in which they originated and across external organizations. The wider the audience the results reach, the larger an impact that analysis can make and the more value that can be created.
For the utility industry, this exposition is often captured in Microsoft Word documents or PowerPoint Presentations with data visualizations getting created either in Mathworks’ MATLAB ™ or Microsoft Excel. The generation of these static reports is time consuming and not done in an automated fashion. If the underlying analysis changes, the updates do not flow through to the report without user effort. Further, no common and searchable platform exists for the rapid propagation of these static reports.
These results then get propagated internally through meetings and memos. Once appropriately sanitized, such findings are distributed externally via industry and government meetings, as papers in academic and industry publications, and in presentations and posters at conferences. Some conferences accept content submissions a few months before the event; other require submission a year or more in advance. Publishing in many academic journals can be a substantially longer process.
(6) Moving Results to Production - Some data analysis projects seek to address a singular question once and the answer or result generated will never be required again. However, for most other analysis projects, this is not the goal. In fact, a result that is required repeatedly is more valuable. For analyses to be useful and truly gain traction, they must be translated from an ad-hoc effort run asynchronously on a laptop to running continuously on live streaming data on production hardware automatically. This allows the result to be experienced, understood, and leveraged by a far wider audience; the analysis becomes useful to all users of the system instead of remaining isolated in a folder on the engineer’s hard drive.
We see this frequently in businesses using relational databases. Reports generated by SQL queries get run to summarize different aspects of the business. Some reports get run quarterly, some get run monthly, and some get run more frequently. In the limit as the frequency increases, the result is a real-time dashboard that continuously updates—moving the original ad-hoc report or analysis into production, potentially accessible to a much wider audience.
For a utility-specific example application or use case we will use a simple event detection algorithm, one that identifies any voltage drop of a certain percentage in a defined window of time. PMU-consuming organizations have indicated that this is not possible with at least some of the data historians currently deployed. Thus, either the company that developed the historian adds this specific new functionality to the historian or a third party builds an independent application that consumes data flowing from the historian to provide event detection. Each option is going to require substantial resources and months of time.
The reason that this state of affairs exists is in part due to software tooling used by the industry including the existing data platforms and the popular analysis packages, such as Mathworks’ MATLAB ™ or Microsoft Excel™. Per the Associate Dean of the Division of Mathematical and Physical Sciences at the University of California at Berkeley, “[r]elying on Excel for important calculations is like driving drunk: no matter how carefully you do it, a wreck is likely.”
THE FUNDAMENTAL PROBLEM WITH THE PIPELINE
Based on the above description of the contemporary utility analytics pipeline, it should be clear why utilities don’t use data better; the process by which analysts and engineers learn from data consumes significant time and resources. Data analytics is an intrinsically iterative process. If the iteration rate is too slow, the emergence of successful use cases leveraging PMU data making it into widespread operational adoption is low.
Walking through every stage of the pipeline can easily consume months of effort if not substantially longer. When one considers the full diffusion of notable results via traditional means, the entire process can take years.
(0) Capture - Step 0 is the exception as it should not lengthen the workflow. However, if unsuccessful, it blocks all subsequent steps.
(1) Access - Step 1, gaining data access, can take days, weeks, or even months depending on the utilities organizational structure and internal politics.
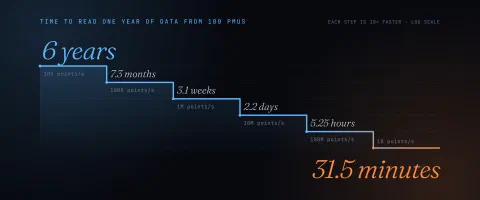
(2) Acquisition - Step 2, acquisition, can be even more problematic. We have seen the task of pulling a month of data from a historian require a month of time and significant engineering support. Even simple data queries requesting a few seconds of data can incur 8-10 minutes of delay [5].
(3) Wrangling and Cleaning - That data cleaning and wrangling typically consume 80% - 95% of the time for the typical data analytics project is only exacerbated by the fact that this effort is repeated for each and every analytics project. The data conditioning done to the data is not pushed back into the historian and the cleaning and conditioning methodologies are not standardized.
(4) Analysis and Modeling – Step 4 is not an engineering task with well-defined schedules but is an exploratory and iterative process that can often be open ended, requiring an unknown amount of time to complete.
(5) Visualization, Reporting, and Results Propagation – All aspects of step 5 are time intensive. Generating the typically static report is a process that can consume days or weeks of effort while disseminating the results both internally and externally can take months or longer.
(6) Moving to Production –There is no quick path to move a one-off analysis into an easily repeatable use case available to everyone given contemporary data architectures. Thus, this last step, even when possible, can literally take years.
Totaling up the worst-case time required to traverse all of these stages could amount to years of time even before taking into account the successful dissemination of results or moving an application to production. Exacerbating this situation further is the fact that many of the steps mentioned above require a human in the loop and are not easily automatable. For example, data is often exported from a historian using a GUI. This makes the process not easily reproducible as all of the actions to complete the ad-hoc analysis cannot be captured in code.
By the nature of this pipeline, work is frequently duplicated. If a new analysis is performed by the same individual, most, if not all, of the steps above will have to be repeated. If a new individual wants to do the same analysis, all steps will inevitably be repeated.
Crucially, there are many steps in the process where the pipeline can outright fail, blocking learning entirely. If PMU data was not captured correctly for the last several years, no analysis is possible. In some cases, often when a significant amount of data is required (such as all synchrophasor data for the last year), the historian simply cannot handle the request. Further, all of the first steps of the pipeline could be successful and generate a potentially world-changing result. However, if there is no obvious path to move this analysis to production, the pipeline has failed.
It is not difficult for engineers and analysts in the utility to observe and intuitively estimate the burdens of this pipeline. They know from personal experience or from the experience of their colleagues that the process is costly and painful. Because of this, rather than taking upwards of one or more years to complete and disseminate, analytics efforts often never happen in the first place.
As discussed above, there are many reasons for the current state of affairs in the industry and detailing each goes far beyond the scope of the paper. However, a potential cause is suggested by the figure below, which casts a slightly different light on the ad-hoc analytics pipeline first shown in Figure 1.
The first half of the ad-hoc analytics pipeline requires skills that fall squarely in the traditional power and electrical engineering disciplines. However, the back half of the pipeline is computer science and software engineering (and even data science), practitioners of which are pulled into many other industries.
TRANSFORMING THE PIPELINE
The most direct way to solve the iteration rate problem described above is to decrease the amount of time required by each stage of the pipeline and, in many instances, this can be accomplished through technology.
(0) Capture - Resolving the problems in this step is trivial when taken seriously. Once the data being captured is widely used, feeding broadly used applications, problems with capture will immediately be noticed and resolved. A properly designed and monitored pipeline will include systems and tools that provide feedback to the pipeline to enable engineers to observe, diagnose, and correct problems at each stage. These upstream optimizations provide cascading benefits to downstream applications. A misconfiguration can be easily caught and fixed preventing the engineer-analyst (and downstream systems of the data platform) from spending unnecessary time processing corrupt data. Additionally, the signal footprint is a function of time – devices are retired and new ones are added frequently, especially during the growth phase. This is important because substantial work has been dedicated to data conditioning for data quality problems that wouldn’t exist if end-to-end system health was monitored and managed.
(1) Access – this step is an internal organizational and policy issue with only a thin layer of technology involved. It is possible to make the data access request process more automated but that is unlikely to resolve the underlying issue. A cultural shift emphasizing the value of ease-of-access is paramount. While not a silver-bullet, one technology consideration for this problem is to be able to create multiple virtual environments partitioned by customers and their use cases where each user can experiment and manipulate and transform the data as they see fit without any fear of impacting the original or archived data.
(2) Acquisition – The time required to acquire the data could be completely eliminated if the historian were not simply a repository but an actual data platform that could enable interactive exploration of the data at scale in real-time and faster than real-time analysis and computation. Traditional acquisition also assumes that the best solution is to bring the data to the computation whereas, for large data sets, it makes more sense to move the computation to the data. This itself will be a shift in both technology as well as philosophy.
(3) Wrangling and Cleaning – Synchrophasor data quality problems often arise from issues in the data capture and archival phases. Solving these problems makes data cleaning much easier. More fundamentally, data cleaning should be handled at the time of ingest by a predefined array of functions in a standardized form. This way, the work is done once instead of being repeated by each analyst touching the data. Having a standard set of PMU (or other sensor type) data cleaning policies would also help facilitate inter-organizational data exchange. However, there are some analytics in the pipeline which are designed to manage their own data quality issues internally and prefer raw, unrefined data.
(4) Analysis and Modeling – While it may not be possible to remove all uncertainty from tasks that are exploratory in nature, technology can facilitate code sharing and the diffusion of best practices across the utility. This will help avoid duplicate projects and smaller efforts. Further, it would give a chance for often used code to solidify into internal modules and libraries.
(5) Visualization, Reporting, and Results Propagation – The solution here is to use literate programming techniques that allow the engineer to develop the report while performing the analysis; the source code and the report are one and the same. This dynamic notebook could easily be rerun if or when the underlying data changes. Additionally, for appropriate analytics, periodic and event based reports can be disseminated in multiple formats such as text alerts, emails, and web services.
(6) Moving to Production – The movement to production happens when a developed analytic is refined and deployed to a production system. The data platform must either provide a comprehensive API that allows third party applications to easily and rapidly access data or the platform itself must have intrinsic capabilities to run custom analyses continuously and in real-time. In both of these cases, the technologies used in development must parallel the ones used in production so that migration and configuration of analytics is as seamless as possible.
Ideally, the analytics pipeline described above would not be a linear process that results in an isolated, single application but instead a process that represents a virtuous cycle, with each successful analytics project offering the entire organization (and even industry) near immediate improvement as shown in the diagram below.
CONCLUSION
The grid of the future requires a paradigm where technical and business decisions can be made by creating and testing hypotheses against vast amounts of data. These data sets include operational system data from SCADA, PMUs, and DFRs as well as externally sourced data such as weather data, satellite data, and many others. The foundation of this decision-making process is the analytics pipeline – a measurement, collection, transmission, storage, access, and analysis infrastructure. The analytics pipeline of today, replete with substantial bottlenecks, imposes an undue burden on engineers and analysts, pushing the cost of asking all too important questions beyond our reach.
Learning is defined as “the acquisition of knowledge or skills through experience, study, or by being taught.” As experience is often captured as data, data analytics is truly an iterative, multi-step process that aims to answer key questions and to help the organization experiment and learn. The faster that learning occurs, the faster the organization can improve. The faster those results are distributed across the industry, the faster the grid can evolve. Given the volume and nature of the data collected by utilities one can quickly conclude that there are significant opportunities to dramatically improve the world’s largest (and oldest) machine as well as the organizations that build, maintain, and operate it. However, this capability has largely been under-utilized and therefore, the true value and potential has not been realized.
To drive this change, we need to have a philosophy in the utility space that regards data as an asset in much the same way that we regard a transmission line, substation, or generator. In this case, the no-free-lunch theorem certainly holds true. While data is an asset that can provide an ROI if engaged properly, the other rules and responsibilities of assets also apply. In other words, utilities must concern themselves with the maintenance of data, the performance of their data, and the reliability of their data among other concerns. This philosophy manifests itself in an analytics pipeline that is designed to feedback and self-correct, lower the cost and increase the speed of experimentation and learning, and enables the findings to improve both the pipeline and the systems and organizations being monitored.
BIBLIOGRAPHY
- [1] Key Note, 2017 Reliability Leadership Summit, Washington, DC, March 21st, 2017.
- [2] A. von Meier; E. Stewart; A. McEachern; M. Andersen; L. Mehrmanesh, "Precision Micro-Synchrophasors for Distribution Systems: A Summary of Applications," in IEEE Transactions on Smart Grid, vol.PP, no.99, pp.1-1
- [3] PMU Data Quality: A Framework for the Attributes of PMU Data Quality and a Methodology for Examining Data Quality Impacts to Synchrophasor Applications, NASPI PMU Applications Requirements Task Force. NASPI-2017-TR-002, March 2017, Version 1.
- [4] Jeffrey Dean and Sanjay Ghemawat, MapReduce: Simplified Data Processing on Large Clusters. OSDI'04: Sixth Symposium on Operating System Design and Implementation, San Francisco, CA, December 2004.
- [5] In-person conversations with engineers at ISO-NE, Holyoak, MA, 2017