SUMMARY
The delivery of electric power has become synonymous with utility; plug an appliance into the wall and the electricity is just there. The expectation of always on, always available has permeated the consumer psyche from telephone, power and even Internet connectivity. While electrification has earned the distinction of the greatest engineering achievement of the 20th century by the National Academy of Engineering, the 21st century has brought about rapid transformations to the technologies that compose the grid; thus, the grid itself is undergoing a rapid evolutioni.
We will argue that the electric grid that started as a deterministic machine governed fundamentally by well known and understood mathematical equations has transformed into a probabilistic system. We see three key drivers of this metamorphosis. First, even though many of the deterministic components, such as generators and transformers, have well described mechanistic models or at least operate in regions sufficiently approximated by linear relationships, the interconnection of so many devices has created a complex system. While a purist may argue that the uncertainty arising from a complex system differs from a truly random model, the outcome is similar; we aren’t sure what happens for a given set of initial conditions. Second, the market for energy has changed from a simple one well approximated by a single monolithic consumer of a unidirectional power flow to a fragmented market of individual consumers and producers, where production is driven by truly random phenomena such as weather and solar activity. Finally, the grid exists in a world filled with stochastic challenges to the system, such as bird streamers, galloping lines, and geomagnetic disturbances to name just a few. As society has become increasingly dependent on the reliable flow of energy with an increasing need to coax more efficiency from the existing system, these random affects must now be considered part of the greater system as a whole.
KEYWORDS
data science; transformation; sensors; synchrophasor; industrial internet of things;
Introduction
The modern electric grid is a consortium of elements, all of which are interconnected and capable of affecting each other’s state, as well as the overall state of the system. Thousands of generators of varying technologies produce power transported over million miles of high voltage transmission lines, feeding millions of miles of distribution lines to deliver power to millions of customers throughout the continent. Managing this engineering feat are over 3,500 utilities that serve one or more functions in managing the production, transmission, and distribution of electricity. Governing the utilities and ensuring reliable performance are hundreds of Reliability Standards. Enforcing these standards is just a handful of entities: the Federal Energy Regulatory Commission (FERC), the North American Electric Reliability Corporation (NERC), and the Department of Energy (DoE).
Historically, engineers tackle complex problems by deconstructing larger systems into smaller, more manageable components, simplifying or ignoring the other parts of the system. Since its inception, this is how the problem of electric grid has been “solved.” Individual elements and small (relative to the system size as a whole) groupings of elements with well-understood physical properties are analyzed and modeled using deterministic equations. Engineers then take these disparate solutions and combine them to obtain a solution to the system as a whole. Fortunately, engineers have become incredibly good at solving these types of deterministic problems and their approximations have provided us with enough insight to manage and run the grid reliably. However, there are many known limitations and pitfalls with this approach. Fundamentally, models are only as good as one’s understanding of the system to be modeled and can fail to capture system behaviors (such as oscillations) that are unknown ahead of timeii.
These limitations are becoming more apparent as the complexity of the system increases. The system was built for a particular set of more deterministic requirements that have evolved over time. Unidirectional flows on the distribution system are becoming bidirectional. Centralized generation is becoming distributed. Base load generation is becoming variable. Even the assumptions underlying those requirements have changed; the bidirectional energy flows are resulting from a large set of stochastic energy producers.
On top of these changing requirements, society’s reliance on electricity has never been greater. The loss of electricity can translate to billions of dollars of damage and lost opportunity cost in only a few daysiii. Reliable electricity is required by every industry and every person in the industrialized world, so much so that lives and national security depend on its availability every second of every day. As a result, seemingly external, random perturbations, such as bird streamers, galloping lines, geomagnetic disturbances, and vegetation overgrowth, are becoming increasingly important. To drive more efficiency, these stochastic impacts must be considered as part of the system; the originally deterministic machine is transforming into a probabilistic system.
From Deterministic Cars to Probabilistic Waze
The bulk electric system is not the only industry in which this transformation is occurring. In this section, we examine a similar transformation that is arguably further along in an industry with which everyone is familiar, the automobile industry and the most deterministic of machines: the car.
The inner workings of the internal combustion engine have been understood for over a century. Turn the key in the ignition and the air fuel mixture is ignited by spark plugs and the engine comes to life, a predictable outcome well understood by the user a priori. Turning the steering wheel predictably turns the car. To provide feedback to the system operator, a static dashboard frequently composed of analog gauges shows such essential details as current speed in MPH and the rotations of the engine in RPM. The user cannot choose which data is displayed and previously captured data is not accessible. If a component fails or is operating outside of predetermined thresholds, a warning light flashes and the operator hopes that it is only a false alarm.
The problem of moving people and goods utilizing roads started out relatively simple: how best to move individual cars from point A to point B. There were limited inputs (cars), limited pathways (roads), and limited outputs (destinations).
For untraveled routes, users used static geographic visualizations hardcoded on paper and hand-written directions. Even though updated versions were released annually, many maps languished in glove compartments for years. In practice, the end user would learn the optimal path--the roads to take and the roads to avoid as a function of time of day and day of week--over numerous trips. This hyper-local information was not broadcast to others or, if so, the information was only shared with a handful. Specific road conditions were not known ahead of time and only broadcast via radio and local news. Thus, local, stochastic perturbances such as sunshine delays, accidents, rubbernecking, and weather conditions could drastically affect drivers and commute times.
Fast forward to 2015. The car, the deterministic machine previously the focus of the ecosystem, has become a single component in a much larger, stochastic world. To function effectively, society must coordinate hundreds of thousands of vehicles in as efficient a fashion as possible given complex constraints such as the highway structure and geography with numerous random effectors such as traffic patterns, work schedules, and weather patterns. The need to drive more efficiency out of the current system requires rethinking the problem at a higher-level.
“We cannot solve our problems with the same level of thinking that created them.”
- Albert Einstein
Fortunately, through no fault of the automobile industry, a significant percentage of cars have been unintentionally instrumented with smartphones: a relatively inexpensive sensor platform equipped not only with GPS and accelerometers but also, and crucially, high bandwidth data connections. At first, smartphone applications like Google Maps offered digital versions of static maps with one key element of feedback: a blinking blue dot showing the driver’s location in real-time. As Google leveraged historical trip data, Google Maps could provide more optimal paths for its users.
Waze extended this idea further and built a community of users who were willing to provide meaningful feedback about current road conditions. The Waze platform then broadcasts this information back to all app users to provide alternative route options dynamically and tackle the problem of stochastic perturbations to traffic patterns. The next step in these products’ evolution is to suggest different paths to different drivers attempting to make similar trips, thus spreading traffic across the existing roadways, relieving congestion, and more effectively using the existing infrastructure.
The same macro-level factors—the decreasing cost of sensor systems, data storage, and distributed computing infrastructure—that have made feasible systems like Waze and have enabled the transformation of the automobile industry will eventually impact utilities.
From a Deterministic Grid to a Probabilistic System
Stochastic - is synonymous with “random” The word is of Greek origin and means “pertaining to chance” (Parzen 1962, p. 7). It is used to indicate that a particular subject is seen from point of view of randomness. Stochastic is often used as counterpart of the word “deterministic” which means that random phenomena are not involved. Therefore, stochastic models are based on random trials, while deterministic models always produce the same output for a given starting condition.iv
In the 1860’s, Maxwell had laid down a set of partial differential equations that formed the basis for classical electrodynamics and ultimately, circuit theory. These equations describe how electric currents and magnetic fields interact and underlie contemporary electrical and communications engineering. A voltage applied to this power line with certain characteristics will result in a computable current. This allows for models of real and complex systems, like the power grid, to be built from first principles. We are describing exactly how something works from immutable laws of the universe. With these models, one can arguably say that they completely understand the system. That is, given a set of conditions, the important values can be computed for any time either in the past or the future.
However, in today’s grid the system boundaries that engineers need to define are ever increasing in size and complexity; the number of variables that need defining, and the subsequent computational burden of these calculations, is increasing at an exorbitant rate. As a result, the deterministic tools that have proved so valuable over the last century are being stretched to their practical limits. For example, real-time contingency analyses are more computationally heavy than ever, proving ever more difficult to conduct in real-time with the accuracy and precision needed to manage the grid reliably.
1.Sea Change for the Industry
While the billions of elements that comprise the grid are still best modeled as physical systems using deterministic equations, the sum of those elements, and thus the system as a whole, is increasingly becoming a problem best solved utilizing a probabilistic approach. Not only can this approach reduce the need for computation-heavy calculations, but it also can provide new insights to correlations and causations not fully understood previously.
2.Probabilistic Nature of the Marketplace
The electric industry was considered a natural monopoly and was operated as such for many decades. Power production, transmission, and distribution were all controlled by large, vertically-integrated utilities. Under this model, the marketplace for electricity was practically monolithic.
Due to the deregulation of the electric industry, the market has changed dramatically and became open to a large number of new variables. Even so, this market structure was simple enough to effectively be modeled using a deterministic approach. Variables such as day-ahead demand, the timing of peak demand, available generation, and fuel availability could be accurately estimated.
Today, estimating those same variables has become difficult due to the advent of distributed generation, particularly variable renewable energy, along with a myriad of other driving forces. Instead of a small number of market participants, there is now a large number of players; instead of unidirectional flow on the distribution system, distributed generators are creating bidirectional flows of energy; the number of consumers is increasing, and the variability amongst consumer behavior is also increasing; weather impacts generation more so than ever, all while the weather is becoming increasingly unpredictable. The summation of these variables results in a system is becoming increasingly probabilistic in nature.
3.Stochastic Events on the Grid
Just as the performance of the US highway system can be drastically impacted by the occurrence of random events, the United States’ power grid can similarly be affected by a number of different perturbations, all stochastic in nature.
Bird Streamers
Around the turn of the century, Southern California Edison faced a problem of unexplained short circuits in their newest high voltage power lines, some of the highest voltages that had been built to that point (over 200,000 volts)v.
Eagles and hawks would use the high vantage point of the new power lines to spot potential prey. When taking flight from the lines, the birds would relieve themselves of excess mass, creating “bird streamers,” arcs of highly conductive fluid. If this jettison occurred close enough to the transmission tower, the streamer would provide a low impedance path from the energized line to the metal tower, effectively circumventing the insulators and providing a pathway to ground. This resulted in a short circuit, and subsequently caused the organic material to flashover, destroying evidence of the origin of this problem. Unsurprisingly, “bird streamers” had not been accounted for in the original design and the short circuits that arose led to brief power interruptions every few days.
Galloping Lines
Galloping linesvi (Aeolian vibration) [figure 1] is another example of a stochastic phenomenon that can significantly impact the delivery of power to customers. Ice can form on transmission lines in such a fashion as to create an aerodynamic shape. When the wind blows across the line at the right angle and with sufficient speed, lift on the cable is generated. As the line is fixed at both ends, standing waves may be generated; these standing waves can be of sufficient amplitude and force to disconnect the line.
Geomagnetic Disturbances (GMDs)
The sun and its interaction with the Earth introduce additional, unpredictable randomness into the power grid. Our star, a swirling ball of super heated plasma, ejects vast clouds of charged particles at high speed from across its surface and at different trajectories. A glancing blow and a direct hit both have the potential to disrupt the grid. Despite a vast amount of research into our magnetosphere, there is much left to discover in terms of the interactions with Earth. For example, recent research utilizing high performance computing to create a global simulation of the Earth-ionosphere waveguide under the effect of a geomagnetic storm,vii has exposed a previously unknown coupling mechanism between coronal mass ejections and the Earth’s magnetosphere.
Dismissed by many because of their high impact, low frequency nature, GMD events are legitimate threats to the health and stability of the power gridviii. Low magnitude GMD events are fairly common and there is little research investigating the long-term impact to assets and infrastructure. One study regarding long-term geomagnetic storm damage looked at the rate of increase to insurance claims regarding damage to, and malfunctions of, electrical and electronic equipment during highly active solar cycles. While this study examined devices attached to the distribution system and not the high voltage transmission equipment itself, it is likely that the damage was mediated through the power systemix.
To Improve is to Measure
“Measurement is the first step that leads to control and eventually to improvement. If you can’t measure something, you can’t understand it. If you can’t understand it, you can’t control it. If you can’t control it, you can’t improve it.”
- H. James Harrington
The electric industry has been measuring in order to understand, control, and improve as early as 1928 when technicians would drive out to a remote transformer, pull oil from the transformer, and then have the gases dissolved in the oil analyzed. Fast-forward to the 1970’s and the implementation of Supervisory Control and Data Acquisition (SCADA) systems throughout the grid. For the first time, field equipment was monitored and different metrics were recorded in close to real-time. This technology revolutionized the operation and management of the grid. Being able to capture data from disparate locations and aggregate that data in a central location created what system operators today know as situational awareness. In addition, the accuracy of deterministic models increased greatly because more variables were measured, and therefore not estimated.
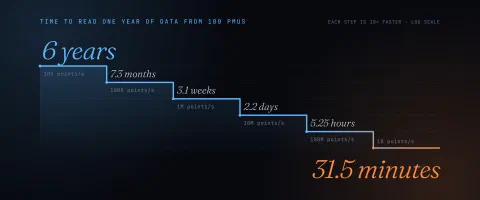
In 2009, the Western Interconnection Synchrophasor Project (WISP) funded the installation of over 300 phasor measurement devices (PMU). PMUs record many of the same system parameters that SCADA does (voltage, current, etc.) but at a much higher frequency; SCADA captures data points once every two to four seconds, while PMUs record samples 30-60 times per second with some newer models offering 240 Hz capture rates. However, the key difference between the two is that the PMUs measurements are synchronized, allowing the direct comparison between data captured at geographically disparate locations. Further, PMU capabilities are being built into numerous components of the grid so that, eventually, most of what has traditionally been considered part of the machine will be instrumented with sensors. This universal, higher frequency data will offer many opportunities for enhanced situational awareness and modeling capabilities.
As more increased efficiency is demanded from a grid being operated near or at the limits of its capacity, the boundaries of the system will be redrawn. What is included as part of the system and what must be instrumented will grow and the volume and variety of the relevant data will increase. Take geomagnetic disturbances for example. In addition to monitoring for ground induced neutral currents, a number of instruments onboard satellites provide data and insight regarding the behavior of solar events. Imaging data at multiple wavelengths, solar wind speed instrumentation, and magnetometers can allow for advanced warnings, on the order of days. Additional satellites sit at the Lagrange point (L1) and provide even more accurate data. Back on terra firma, calibrated magnetometers, controlled and monitored by the USGS provide additional data points. These variable data sources aid the understanding of both the timing and potential magnitude of a GMD, yet fall outside the traditional system boundary drawn by system operators.
The Model is the Data
The mathematical equations describing voltages and currents in conductors and the system of equations that describe the behavior of the grid are a model. This compact representation of an enormous physical system and its operation is far simpler to work with than the real thing. The differential calculus upon which many of these models are based has been taught in universities for decades. Further, the software tools used to solve these equations and explore this model are relatively well known and commercially available.
However, there are some systems for which we cannot build a model using first principles because the phenomenon in question is not understood. The World Wide Web provides us countless examples of such phenomena. Take Twitter for example. How does one model the number of tweets expected from a single user on a given day? What are the first principles upon which such model would be built? To handle these situations, we observe the system that we hope to understand, collecting any and all available data. This collected data then becomes the representation of the system being analyzed—the data is the model.
As an example of this, take the problem of determining the area of a circle. A very precise deterministic model computes the area using two parameters, the constant pi and the radius of the circle. Assume for a moment that this compact representation did not exist. How else could the area be measured?
One technique would be to employ a Monte Carlo simulation. A circle is inscribed in a square and a set of test points [x, y] is randomly distributed throughout the defined system. Each test point is examined for whether or not the point is within in the circle and the result, a yes or no is recorded. As the number of random points generated and tested increases, an increasingly accurate representation of the circle’s area is developed. More data results in a more accurate model. In fact, the data literally becomes the model, as seen in figure 2 below.
Conclusion
This paper sketched the argument for why the United States power grid, traditionally considered a deterministic machine, is transforming into a probabilistic system. This transformation is driven by three key factors: (1) the growing size and complexity of the system, (2) the changing nature of the marketplace consuming (and producing) the product, and (3) the increasing impact of stochastic events. We discussed the parallel transformation of the car and the US highway transportation system, a metamorphosis that is arguably further along and suggests one possible future outcome for the grid.
Not addressed in this paper but of critical importance, this transformation will have radical implications for how this machine is maintained, operated, regulated, and enhanced. Further, advances in data science, computer science, and the proliferation of intelligent devices will play the primary role for managing the “grid of the future.”
BIBLIOGRAPHY
- i Greatest Engineering Achievements of the 20th Century, http://www.greatachievements.org/, National Academy of Engineering
- ii Burges, Thomas, The Importance of Modeling, NASPI Model Validation Workshop October 22, 2013
- iii Minkel, J. R., The 2003 Northeast Blackout--Five Years Later, Scientific American Online, August 13, 2008. http://www.scientificamerican.com/article/2003-blackout-five-years-later/
- iv Origlio, Vincenzo. "Stochastic." From MathWorld--A Wolfram Web Resource, created by Eric W. Weisstein. http://mathworld.wolfram.com/Stochastic.html
- v Charles Choi, The Forgotten History of How Bird Poop Cripples Power Lines, IEEE Spectrum, http://spectrum.ieee.org/energywise/energy/environment/bird-poop-can-cripple-power-grids
- vi Galloping of overhead transmission lines - http://www.tdee.ulg.ac.be/doc-26.html
- vii Jamesina Simpson, University of Utah - Petascale Computing: Calculating the Impact of a Geomagnetic Storm on Electric Power Grids https://www.youtube.com/watch?v=CrYc0FG8DT8
- viii NERC, 2012 Special Reliability Assessment Interim Report : Effects of Geomagnetic Disturbances on the Bulk Power System, February 2012.
- ix Schrijver, C. J., R. Dobbins, W. Murtagh, and S. M. Petrinec (2014), Assessing the impact of space weather on the electric power grid based on insurance claims for industrial electrical equipment, Space Weather, 12, 487–498, doi:10.1002/2014SW001066.