SUMMARY
Next generation sensors are being increasingly installed across the grid with many already deployed, embedded within smart assets, but dormant. Demonstrated applications for these data span situational awareness, capital investment optimization, and grid reliability and resiliency tools. New data-driven applications will be instrumental in addressing knowledge gaps operating a grid with high penetration of renewables and end-use technologies as market and policy drivers continue to catalyze their adoption.
Yet to build and enable new data-driven tools at scale requires fast and easy access to data volumes and velocities that far outstrip the capabilities of a single computer and that legacy utility data platforms are unable to handle. Slow data blocks the development and operationalization of new workflows and applications. Furthermore, fast query performance is foundational to developing applications that involve machine learning (ML) or artificial intelligence (AI), essential techniques to extracting value from data at scale. Without fast data, utility digitalization initiatives ring hollow despite the fact that the most capital-intensive part—sensor deployment for data acquisition—has been largely completed.
The prevailing belief is that new ideas about how sensor data can create value must be time and labor intensive (and thus expensive) to explore. However, countless other industries have demonstrated that effective use of technology (e.g., cloud, data platforms, and machine learning libraries) can yield cost effective innovation with data.
This paper describes an ARPA-E funded Open Innovation 2018 project entitled the National Infrastructure for Artificial Intelligence on the Grid (NI4AI). NI4AI was designed to provide the energy sector, including utilities, researchers, students, and innovators, with access to a state-of-the-art time series data platform called PredictiveGridTM. The project provides general access to open, public data sets and controlled, secure access to industry-owned data. In doing so, the project is building a community dedicated to advancing the use of analytics, machine learning, and AI tools on the grid.
KEYWORDS
Data analytics, artificial intelligence, machine learning
INTRODUCTION
The grid is evolving rapidly as generation, distribution, and consumption technologies are changing to enable grid decarbonization and end-use electrification. These changing dynamics create new uncertainty and risk against operations and planning decisions for the grid.
For example, inertial generators are being replaced with inverter-based resources governed by black-box controllers with unknown behavioral characteristics. Poorly tuned controllers may lead to unexpected loss of generation and may introduce other unpredictable & undesirable dynamics. Even under normal operating conditions, intermittent generation adds variability that increases uncertainty in balancing load and supply. Meanwhile, electrification is changing consumer requirements for reliability, while severe outages linked to extreme weather and wildfire risk have catalyzed the adoption of distributed resources for local resilience. Technology change is accelerating due to market drivers despite open questions about how best to plan and operate a grid dominated by new, evolving technologies. Once readily predictable with understood physics-based models, the modern grid has become riddled with uncertainty.
Rapid changes give rise to new and unforeseen issues in complex systems. The ability to respond quickly and effectively starts with visibility and awareness of these issues. However, many of the new silicon-based technologies connected to the grid are black boxes whose operation even under normal conditions are unknown let alone their behavior during extreme events. Further, the transient that possibly starts the next forest fire and the high frequency harmonics that ripple across the grid with unknown implications are invisible to SCADA systems. Utilities must increasingly rely on high-frequency sensor data with high-percentage system coverage to understand the contemporary grid. These results have motivated investments in high-frequency sensors (e.g., PMUs, digital fault recorders, and continuous point-on-wave sensors) to enable a wide variety of applications for improving the grid.
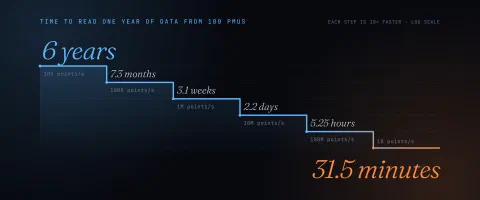
Sensing is only the first step as processing data from such sensors creates new computational challenges. A single stream or channel or signal from a 60Hz PMU generates 1.89 billion measurements per year. To put the problem into perspective, a data platform that can read data at 100,000 measurements per second would take over five hours to retrieve this data from disk, making analysis cumbersome at best. Time series data at scale requires exponentially faster performance, a challenging computer science problem that cannot be solved using conventional database technologies and one that has not been widely acknowledged or discussed in the industry.
Many utility analytic systems ignore this problem by focusing almost exclusively on real-time or event-triggered sensor data. By focusing on a very narrow window of time, an analytic or application reduces the amount of data, artificially constraining the problem. However, such technical limitations also dramatically reduce the space of analytics that can be employed to solve the very problems that utilities now face. Retention and analysis of full data archives is foundational to developing new algorithms capable of detecting emerging dynamics and exploiting new opportunities that are arising as generation, distribution, and end-use technologies continue to change.
Solution
A National Infrastructure for AI on the Grid (NI4AI) is a multi-year project funded by the US Department of Energy’s Advanced Research Projects Agency (ARPA-E) to eliminate barriers to the adoption of data-driven tools for improving the grid. NI4AI has a 3-fold mission:
- Platform - provide widespread access to a data platform architected to streamline workflows for domain experts in power systems to interface with very large time series data sets,
- Data - collect and host a variety of both public and private data sets for collaborators to develop and test new algorithms, and
- Community - build a community of utilities and experts dedicated to advancing the use of data analytics, machine learning, and AI tools on the grid.
Figure 1 provides an overview of the project components.
TASK 1 – DATA PLATFORM
NI4AI provides open access to a commercially available big data platform (PingThings’ PredictiveGrid) purposely built to address data management and analytical challenges unique to continuously streaming time series from large sensor fleets. The platform was designed to enable researchers and practitioners working with data to quickly and effortlessly interact with arbitrarily large volumes of time series data on a day-to-day basis. Fast and intuitive data workflows are foundational to facilitating the discovery of broad and varied use cases, as detailed below. The platform also provides tools for sharing and deploying code built with collaborators, thus reducing the time to explore and test new analytics as a team or across organizations. Finally, the project leverages partnerships with utilities that have deployed the platform both commercially and through pilots facilitated as part of the project, creating a direct path to test and deploy new analytics in a real-world setting.
The platform, shown in figure 2, is a horizontally scalable, distributed computing system. Each of the key components—the multi-faceted storage system, time series data processing engine, ingest layer, and API and access control layer—can be horizontally scaled to meet dynamic performance requirements. The platform is run in the cloud, enabling both nearly unlimited expansion capabilities and a vast array of computing and storage options to optimize performance as a function of cost.
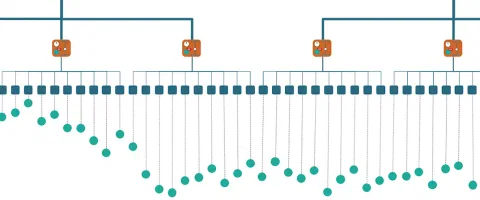
The platform’s innovations in time series data storage deserve mention. Upon ingestion, data are stored in a hierarchical time-partitioned tree structure that computes statistical aggregates (minimum, maximum, mean, standard deviation, and count) at various time scales. This offers provably exponential acceleration for many types of queries and analytics. To implement this novel data structure, we could not repurpose an existing relational or nosql database. Instead, the platform uses a custom-built time series database called BTrDB (the Berkeley Tree Database) [2] specifically architected for fast and intuitive visualization and programmatic access to arbitrarily large time series data sets [3]. By focusing on the storage and retrieval of time series data, with distinct read and write patters, a large number of optimizations could be implemented that yield orders of magnitude performance and memory efficiency gains compared to other, more general storage engines.
The platform ingests streaming and bulk data from various types of sensors (e.g., Digital Fault Recorders, Power Quality Monitors, Phasor Measurement Units, Relays, Smart Meters, continuous Point on Wave etc.). Data are stored in a manner specifically designed to facilitate exploratory data analysis and AI/ML algorithm development.
TASK 2 – DATA COLLECTION
A data platform devoid of data is useless. Data collection for this project focuses on two types of data:
- Open access data that is broadly available to anyone with an NI4AI user account and
- Proprietary data ingested as part of pilot projects with different organizations. Access to these data sets are tightly controlled by the sponsoring organization.
The aim of the open access data sets is to capture both local and wide-area dynamics relevant to supporting the exploration and development of new analytics for the grid.
Open data in the platform is archived under “collections,” groupings of streams defined based on the origin of the data – such as the data type, sensor placement, and device. The paragraphs below describe collections publicly available to NI4AI users.1 Table 1 summarizes select time series data available in the NI4AI platform.
| Type | Collections | Sensors | Points | Features |
|---|---|---|---|---|
| Streaming NI4AI PMUs | ni4ai/ | 11 (to date) | 38x109 | Real-time; Continuous |
| Point-on-wave data | signatures/ | 250 | 7x10⁶ | Labelled fault events |
| GridSweep/ | 1 | 2x10⁹ | 24-hour continuous data | |
| sentinel/ | 9 | TBD | Wide area; continuous | |
| Distribution PMU data | sunshine/ | 6 | 330x109 | PV array |
| golden/ | 9 | 94x109 | Dense coverage |
1 Users may access the data for free by registering for an account at https://ni4ai.org.
Streaming PMU Data
ni4ai: This data collection provides open access to streaming data from a network of sensors deployed across the country as part of the NI4AI project. The data captures 60 Hz voltage phasor measurements from microPMU sensors installed in wall outlets. Sensors are geographically distributed to achieve wide-area coverage of the grid. The upcoming year (2022) will see deployment of several additional sensors to improve spatial coverage across all three interconnects. The figure below shows the locations of streaming sensors.2
2 An up-to-date map of streaming sensor locations can be found on our blog https://blog.ni4ai.org.
Distribution PMU Data Collections
sunshine: This data collection provides 18 months of continuous monitoring data on a distribution system in a sunny climate with significant solar PV generation. The data were collected with micro-PMUs during an early research deployment. Each PMU reports data at 120 frames per second on twelve channels: three-phase voltage and current, giving root-mean-square magnitude and phase angle for each.
The six sensor locations correspond to three substation buses, one large PV array, and two university buildings. While all six are within the same city, there are three separate distribution circuits, equipped with two sensors each. The dataset was collected for academic power engineering research and has been anonymized to remove sensitive and location-specific information.
golden: This data collection provides three months of continuous monitoring data from micro-PMUs installed during an early research deployment. Each PMU reports data at 120 frames per second on twelve channels: three-phase voltage and current, giving root-mean-square magnitude and phase angle for each.
The data includes nine micro-PMUs installed on two adjacent distribution feeders. PMU1 is sited at the substation and additional sensors are number sequentially based on their geographic distance from the substation. Note that electrical connectivity of the sensors may change over time due to changes in network configuration.
Point on Wave (POW) Collections
POW/GridSweep: The GridSweep collection includes data generated by a novel active probing device being developed to measure the grid’s dynamic response to small perturbations. The data include 4kHz continuous point-on-wave measurements recorded over several tests. Tests to date include 24-hours continuous (and passive) recording from a 120V wall outlet and 5 hours continuous recording in a laboratory testbed with both passive measurements and active probing. Source data and detailed documentation about each of the tests performed may be found in the Google Drive folder linked below.3
POW/signatures: This data collection provides access to point-on-wave measurements for upwards of 250 power quality disturbances reported in the DOE/EPRI National Database Repository of Power System Events.4 Each disturbance includes a 2-second snapshot of three-phase oscillography data for voltage and current, as well as neutral current. Each event signature also includes detailed metadata with labels obtained by post-mortem investigates into what triggered the event. Labels include the cause (e.g., lightning, transformer failure, etc.).
POW/underground: This data collection reports 24-hours of three-phase continuous point-on-wave bus voltage and feeder current measurements on an 8kV XPLE underground cable.5 Where most point-on-wave data generated today (e.g., by digital fault recorders) focuses on event-triggered snapshots of data, continuous monitoring data provides a basis for enabling novel analytics establishing a baseline for what constitutes “normal” conditions on the grid. Advancing our understanding of these baseline conditions is central to improving visibility into anomalies, including known dynamics that may trigger DFR devices as well as dynamics indicative of latent issues that legacy event-triggered devices may not detected.
POW/sentinel: This data collection provides access to time-synchronized continuous point-on-wave measurements recorded by a network of nine 50kHz sensors deployed between 2012-2015. The deployment was led by MITRE Corporation in the aftermath of the 2003 blackout to study precursors of voltage collapse. Details about the data, as well as an application of the data to study voltage collapse, are detailed in Taylor et. al. 2016 [4].
3 GridSweep source data and documentation: https://drive.google.com/drive/folders/1pe6WBQkCRDyOXNsVKfA-eW4_RjuJsOOB
4 DOE/EPRI Disturbance Library source data: https://pqmon.epri.com/
5 Source data and documentation: https://grouper.ieee.org/groups/td/pq/data/downloads/XLPE_data.pdf
TASK 3 - COMMUNITY
The third and final thrust of the project focuses on building community around the advancement of data analytics for the grid. Mechanisms include generating training materials and educational content to advance both practical skills and research ideas related to data exploration and algorithm development. Core components of this effort include presentations/workshops, python tutorials, and recruitment of users to the platform and data to advance their own work.
The project has hosted several events to build awareness about the platform and project. Events include a CIGRE Academy workshop, ISGT tutorial, IEEE SGSMA tutorial, presentations at NASPI and other industry working group meetings, as well as several invited talks with organizations interested to engage with the project as pilot participants, sensor hosts, or possible users of the data. Upwards of 300 users have registered to access the NI4AI platform because of these efforts. Materials and recordings of several of these presentations can be found on the project blog.6
In addition to presentation materials, the project has generated a series of hands-on Python tutorials providing code that users may directly leverage to gain familiarity with big data workflows using the platform, or with analytical methods commonly used with PMU and point-on-wave data. These materials are publicly available in Github7, and include a guide for new users of the platform and a growing library of analytics that users may run using public data or using their own proprietary data in the platform. Users may also use the code as a foundation upon which to begin exploring new questions and building new algorithms of their own.
The final community-building aspect of the project focuses on working in partnership with industry stakeholders to enable data exploration, algorithm development, or algorithm deployment on their own data (i.e., data not released in the open access platform). This task may include deployment of algorithms provided in our Github repository, algorithms developed internally by data analysts, or algorithms developed in partnership with research collaborators. By using a common platform for developing and deploying analytics on data from different sources – such as from research pilots as well as full-scale sensor deployments by industry, the project aims to facilitate knowledge exchange and collaboration across institutions. Workshop materials (cited above) provide a rich resource for possible new users of the platform to learn about analytical methods and best practices for launching a successful data analytics program within a utility.
6 NI4AI project blog: https://blog.ni4ai.org
7 NI4AI project Github : https://github.com/PingThingsIO/ni4ai-notebooks
Analytical Case Study: Voltage sag detection
Data in the platform has been used to explore and develop a wide variety of analytics both by researchers and industry practitioners. While the NI4AI project itself is principally focused on providing access to the platform, data, and educational content needed to facilitate analytical advancements by the industry – a wide variety of use cases have been developed to date by users of the platform. Below, we summarize an example using NI4AI platform and data to develop a computationally efficient algorithm for voltage sag detection.
This use case reported in [7] applied the sunshine data to develop an algorithm for quickly mining through three months of high-frequency (120 Hz) data to detect and characterize voltage sags recorded by four micro-PMUs. The algorithm was used to characterize differences in voltage sags observed by different devices. The algorithm itself was implemented using Python, and the code is available on Github. Readers are encouraged to register for an NI4AI login to access the sunshine data and run the analytic on their own machine.8
Figure 3, below, shows a basic schematic diagram of the network from which the sunshine data originates from. The data set was used to examine differences in voltage sag magnitude or frequency observed on circuits with and without solar PV.
By looking at the results, it is easy to see the relationship between the solar array and the effect on voltage sags. Figure 4, below, shows the voltage sag events for the given timeframe. Each PMU is labeled with different colors. It is clear looking at the chart that the PMU1 with the attached solar generation experienced less severe voltage sags than PMU3 which is on the same circuit. The same observation cannot be made of PMU4 and PMU5, which both experienced characteristically larger voltage sags than were observed on the circuit with the solar PV array.
8 Voltage Sag Detection code is available in NI4AI Github repository.
GETTING INVOLVED
DOE ARPA-E is funding this project to help the energy sector extract more value from massive data stores being generated by the wide variety of sensors deployed to date – including digital fault recorders, power quality monitors, phasor measurement units, relays, smart meters, continuous point-on-wave, and others. These data have traditionally been siloed in data systems that lack the speed needed for people to work effectively and productively with the data. Performance limitations of many legacy data platforms which make it labor intensive for users to perform simple tasks such as extracting data for visualization purposes can cripple more advanced data workflows such as algorithm development and AI/ML training and testing pipelines.
For utilities, involvement in the project offers a fast and easy way to enable data-driven applications to improve their grid. US utilities may engage in platform pilots providing internal data analysts and/or external collaborators with state-of-the-art data analytics software to increase the speed of problem solving.
For researchers, the project provides access to a rich repository of empirical grid data, providing a mechanism to demonstrate that algorithms are robust to the complexities of real-world sensor data. Participating in workshops (as an attendee or panelist) also provides a mechanism to promote new ideas and find like-minded individuals for collaboration.
For instrument manufacturers, contributing open data provides a pathway for demonstrating their technology, while engaging in platform pilots provides an opportunity to rapidly advance algorithm development using a state-of-the-art computational tool.
CONCLUSION
The NI4AI project helps reduce risk and burden to organizations seeking to advance the use of data-driven tools for improving the grid. It helps promote best practices around data performance, scalability, and secure cloud data exchange. The project enables rapid development of new analytics and allows community members and their ideas to thrive. To learn more - go to http://www.ni4ai.org/
BIBLIOGRAPHY
- [1] Kevin Jones. Zero to One: A Utility Playbook for (Finally) Delivering Sustainable Value from Your Synchrophasor Data by Enabling Easy Data Exploration and Rapid Use Case Prototyping. CIGRE Grid of the Future Symposium. November 2019.
- [2] Michael P. Andersen and David E. Culler. BTrDB: Optimizing Storage System Design for Timeseries Processing. Proceedings of the 14th USENIX Conference on File and Storage Technologies (FAST ’16). February 2016. URL: https://www.usenix.org/system/files/conference/fast16/fast16-papers-andersen.pdf
- [3] Sam Kumar, Michael P Andersen, and David E. Culler. Mr. Plotter: Unifying Data Reduction Techniques in Storage and Visualization Systems. Technical Report No. UCB/EECS-2018-85. May 2018. https://www2.eecs.berkeley.edu/Pubs/TechRpts/2018/EECS-2018-85.pdf
- [4] Robert M. Taylor Jr., Jeffrey P. Woodard, and Creighton T. Hager. A minimal digital circuit realization for robust voltage collapse detection. IEEE Power and Energy Conference at Illinois (PECI). February 2017. DOI: 10.1109/PECI.2017.7935741.
- [5] Theo Laughner, Sean Murphy and Mohini Bariya. Building a National Infrastructure for Artificial Intelligence on the Grid. PACWorld Magazine. September 2020. Available here: https://www.pacw.org/building-a-national-infrastructure-for-artificial-intelligence-of-the-grids